
GitHub Graph
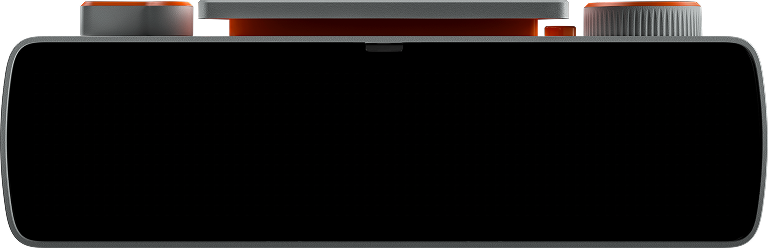
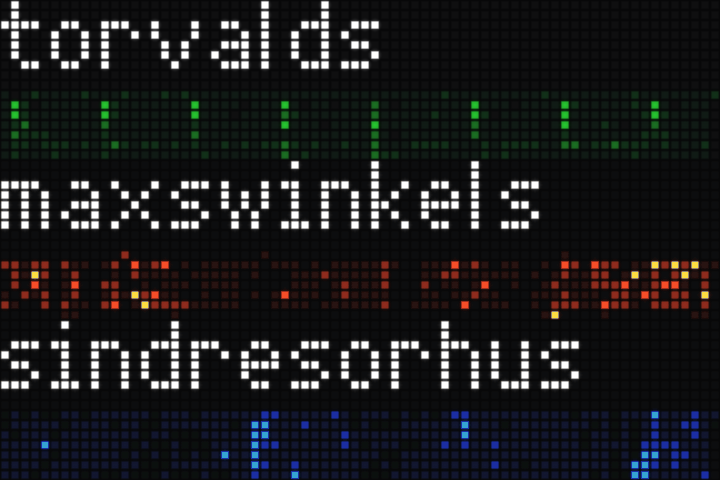
Your GitHub contribution graph on the bar. Username in a 7px pixel font above 72 weeks of history, one pixel per day. Long names scroll, and there are green, orange, and blue themes.
How to run
This app is a single Python file that talks directly to the BUSY Bar HTTP API: no libraries, no setup. Connect your bar via USB and run:
python app.py
Over USB the bar is always at 10.0.4.20. On Wi-Fi, pass the bar's IP
with --host <address>.
No bar at hand? Run the
BUSY Bar Emulator
and point the app at it: python app.py --host 127.0.0.1:8080.
To keep it running without a terminal open, install it with busybar-manager, which handles the virtualenv, autostart and scheduling, and lets you switch between apps from a web dashboard.
Source code
#!/usr/bin/env python3
"""GitHub contribution graph: the username above 72 weeks, one pixel per day.

    python3 apps/github_graph.py [--host 127.0.0.1:8080] [--user torvalds] [--theme green|orange|blue] [--test]
"""
import argparse
import datetime
import json
import re
import struct
import time
import urllib.error
import urllib.request
import zlib

APP = "github-graph"

# Per-day colors by contribution level, alpha 255. Level 0 is nearly off so
# quiet days read as texture holes, like the real graph. Saturated hues with
# low secondary channels survive the display's gamma curve.
THEMES = {
    "green": [   # GitHub dark
        (10,  26,  16, 255),
        (14,  68,  41, 255),
        (0,  109,  50, 255),
        (38, 166,  65, 255),
        (57, 211,  83, 255),
    ],
    "orange": [  # GitHub Halloween
        (24,  14,   6, 255),
        (99,  28,   3, 255),
        (189, 86,  29, 255),
        (250, 122, 24, 255),
        (253, 223, 104, 255),
    ],
    "blue": [
        (8,   16,  28, 255),
        (10,  50, 110, 255),
        (0,   90, 200, 255),
        (30, 140, 255, 255),
        (90, 190, 255, 255),
    ],
}


FONT = {  # 7px pixel font (rows top to bottom, LSB = rightmost column)
    'a': (4, 5, [0, 0, 6, 1, 7, 9, 7]),
    'b': (4, 5, [8, 8, 14, 9, 9, 9, 14]),
    'c': (4, 5, [0, 0, 7, 8, 8, 8, 7]),
    'd': (4, 5, [1, 1, 7, 9, 9, 9, 7]),
    'e': (4, 5, [0, 0, 6, 9, 15, 8, 6]),
    'f': (4, 5, [2, 5, 4, 15, 4, 4, 4]),
    'g': (4, 5, [0, 0, 7, 9, 7, 1, 6]),
    'h': (4, 5, [8, 8, 14, 9, 9, 9, 9]),
    'i': (3, 4, [2, 0, 6, 2, 2, 2, 7]),
    'j': (3, 4, [1, 0, 1, 1, 1, 1, 6]),
    'k': (4, 5, [8, 8, 9, 10, 12, 10, 9]),
    'l': (1, 3, [1, 1, 1, 1, 1, 1, 1]),
    'm': (5, 6, [0, 0, 30, 21, 21, 21, 21]),
    'n': (4, 5, [0, 0, 14, 9, 9, 9, 9]),
    'o': (4, 5, [0, 0, 6, 9, 9, 9, 6]),
    'p': (4, 5, [0, 0, 14, 9, 14, 8, 8]),
    'q': (4, 5, [0, 0, 7, 9, 9, 7, 1]),
    'r': (4, 5, [0, 0, 14, 9, 8, 8, 8]),
    's': (4, 5, [0, 0, 7, 8, 6, 1, 14]),
    't': (4, 5, [4, 4, 15, 4, 4, 4, 3]),
    'u': (4, 5, [0, 0, 9, 9, 9, 9, 7]),
    'v': (5, 6, [0, 0, 17, 17, 10, 10, 4]),
    'w': (5, 6, [0, 0, 17, 21, 21, 10, 10]),
    'x': (5, 6, [0, 0, 17, 10, 4, 10, 17]),
    'y': (4, 5, [0, 0, 9, 9, 7, 1, 6]),
    'z': (4, 5, [0, 0, 15, 2, 4, 8, 15]),
    '0': (5, 6, [14, 17, 19, 21, 25, 17, 14]),
    '1': (5, 6, [4, 12, 20, 4, 4, 4, 31]),
    '2': (5, 6, [14, 17, 1, 6, 8, 16, 31]),
    '3': (5, 6, [14, 17, 1, 6, 1, 17, 14]),
    '4': (5, 6, [6, 10, 10, 18, 18, 31, 2]),
    '5': (5, 6, [31, 16, 16, 30, 1, 1, 30]),
    '6': (5, 6, [14, 17, 16, 30, 17, 17, 14]),
    '7': (5, 6, [31, 1, 2, 4, 4, 8, 8]),
    '8': (5, 6, [14, 17, 17, 14, 17, 17, 14]),
    '9': (5, 6, [14, 17, 17, 15, 1, 17, 14]),
    '-': (3, 4, [0, 0, 0, 7, 0, 0, 0]),
    '_': (4, 5, [0, 0, 0, 0, 0, 0, 15]),
    '.': (1, 4, [0, 0, 0, 0, 0, 0, 1]),
}


def draw_text(rgba, W, text, color=(255, 255, 255, 255)):
    """Draw text into the RGBA buffer at the top-left corner, 7px tall."""
    pen = 0
    r, g, b, a = color
    for ch in text.lower():
        glyph = FONT.get(ch)
        if glyph is None:
            pen += 4
            continue
        w, adv, rows = glyph
        for yy, mask in enumerate(rows):
            for xx in range(w):
                if mask & (1 << (w - 1 - xx)) and pen + xx < W:
                    o = (yy * W + pen + xx) * 4
                    rgba[o] = r
                    rgba[o + 1] = g
                    rgba[o + 2] = b
                    rgba[o + 3] = a
        pen += adv
        if pen >= W:
            break


def name_width(text):
    """Pixel width of text in the embedded font."""
    return sum(FONT.get(ch, (0, 4, []))[1] for ch in text.lower())


def make_png(width, height, rgba):
    """Encode raw RGBA bytes into a PNG (stdlib only)."""
    def chunk(tag, data):
        return (struct.pack(">I", len(data)) + tag + data +
                struct.pack(">I", zlib.crc32(tag + data) & 0xFFFFFFFF))
    raw = bytearray()
    for y in range(height):
        raw.append(0)  # filter: none
        raw.extend(rgba[y * width * 4:(y + 1) * width * 4])
    return (b"\x89PNG\r\n\x1a\n"
            + chunk(b"IHDR", struct.pack(">IIBBBBB", width, height, 8, 6, 0, 0, 0))
            + chunk(b"IDAT", zlib.compress(bytes(raw), 9))
            + chunk(b"IEND", b""))


def fetch_contributions(user, year=None):
    """Fetch (date_str, level_int) pairs from the GitHub contributions page.
    Without a year this is the rolling last 12 months; with a year GitHub
    returns that full calendar year."""
    url = f"https://github.com/users/{user}/contributions"
    if year is not None:
        url += f"?from={year}-01-01&to={year}-12-31"
    req = urllib.request.Request(
        url,
        headers={"User-Agent": "Mozilla/5.0 (compatible; busybar-github-graph/1.0)"},
    )
    with urllib.request.urlopen(req, timeout=15) as resp:
        html = resp.read().decode("utf-8", errors="replace")
    return parse_contributions(html)


def parse_contributions(html):
    """Extract (date_str, level_int) pairs from GitHub contributions HTML."""
    # Match any tag containing data-date; then pull both attrs out separately.
    tags = re.findall(r'<[^>]+data-date[^>]+>', html)
    pairs = []
    for tag in tags:
        date_m = re.search(r'data-date="(\d{4}-\d{2}-\d{2})"', tag)
        level_m = re.search(r'data-level="(\d)"', tag)
        if date_m and level_m:
            pairs.append((date_m.group(1), int(level_m.group(1))))
    return pairs


def fake_contributions():
    """Generate deterministic fake (date_str, level) data for --test mode."""
    today = datetime.date.today()
    # anchor = most recent Sunday on or before today
    anchor = today - datetime.timedelta(days=(today.weekday() + 1) % 7)
    start = anchor - datetime.timedelta(weeks=71)
    pairs = []
    for week_index in range(72):
        for weekday in range(7):
            d = start + datetime.timedelta(days=week_index * 7 + weekday)
            if d > today:
                break
            level = max(0, (week_index * 3 + weekday * 5) % 9 - 4)
            pairs.append((d.isoformat(), level))
    return pairs


def render_png(pairs, user, today, colors):
    """Build the full 72x16 display PNG: the username in the embedded 7px
    pixel font flush in the top-left corner, and below it the contribution
    grid where every day is exactly one pixel: 72 week columns edge to edge,
    7 day rows, colored by the day's level."""
    # anchor = most recent Sunday on or before today
    anchor = today - datetime.timedelta(days=(today.weekday() + 1) % 7)
    start = anchor - datetime.timedelta(weeks=71)

    W, H = 72, 16
    rgba = bytearray(W * H * 4)  # all zeros = fully transparent
    GRID_Y = 9  # day grid on rows 9-15; the 7px name renders on rows 0-6

    level_counts = [0, 0, 0, 0, 0]
    days_placed = 0
    for date_str, level in pairs:
        try:
            d = datetime.date.fromisoformat(date_str)
        except ValueError:
            continue
        if d < start or d > today:
            continue
        delta = (d - start).days
        week = delta // 7   # 0..71
        row = delta % 7     # 0..6 (Sunday=0 .. Saturday=6)
        if week > 71 or row > 6:
            continue
        r, g, b, a = colors[level]
        o = ((GRID_Y + row) * W + week) * 4
        rgba[o] = r
        rgba[o + 1] = g
        rgba[o + 2] = b
        rgba[o + 3] = a
        level_counts[level] += 1
        days_placed += 1

    if user is not None:
        draw_text(rgba, W, user)
    return make_png(W, H, bytes(rgba)), days_placed, level_counts


def api_request(host, method, path, body=None, content_type=None):
    """Make an HTTP request; return (status, body_bytes)."""
    url = f"http://{host}{path}"
    headers = {}
    if content_type:
        headers["Content-Type"] = content_type
    req = urllib.request.Request(url, data=body, headers=headers, method=method)
    try:
        with urllib.request.urlopen(req, timeout=15) as resp:
            return resp.status, resp.read()
    except urllib.error.HTTPError as e:
        return e.code, e.read()


def upload_and_draw(host, png_bytes, scroll_user=None):
    """Upload the display PNG asset and draw it full screen. When the name is
    too wide for the matrix it is not baked into the PNG; instead a device
    text element scrolls it across the top (scroll_rate is px per minute)."""
    # Upload
    path = f"/api/assets/upload?application_name={APP}&file=graph.png"
    status, _ = api_request(host, "POST", path, body=png_bytes,
                             content_type="application/octet-stream")
    if status not in (200, 201, 204):
        print(f"  upload returned HTTP {status}")

    # Draw: one full-screen image; name and grid are both baked into the PNG
    # with the embedded pixel font, so every pixel matches on any display.
    elements = [{"type": "image", "path": "graph.png", "x": 0, "y": 0, "id": "graph"}]
    if scroll_user is not None:
        elements.append({"type": "text", "text": scroll_user, "x": 0, "y": -1,
                         "font": "normal", "color": "#FFFFFFFF",
                         "width": 72, "scroll_rate": 480, "id": "name"})
    payload = json.dumps({
        "application_name": APP,
        "elements": elements,
    }).encode()
    status, body = api_request(host, "POST", "/api/display/draw",
                                body=payload, content_type="application/json")
    if status == 409:
        print(f"  409 Conflict: another app holds the screen at higher priority")
    elif status not in (200, 201, 204):
        print(f"  draw returned HTTP {status}: {body[:120]}")


def run(args):
    today = datetime.date.today()

    if args.test:
        pairs = fake_contributions()
        fits = name_width(args.user) <= 72
        png, days_placed, levels = render_png(pairs, args.user if fits else None, today, THEMES[args.theme])
        upload_and_draw(args.host, png, scroll_user=None if fits else args.user)
        print(f"[test] user={args.user} days={days_placed} "
              f"L0={levels[0]} L1={levels[1]} L2={levels[2]} L3={levels[3]} L4={levels[4]}")
        return

    while True:
        today = datetime.date.today()
        try:
            merged = {d: lv for d, lv in fetch_contributions(args.user)}
            # 72 weeks of history spans past the rolling year; the previous
            # calendar year fetch fills in the older columns.
            prev_year = (today - datetime.timedelta(weeks=71)).year
            if prev_year < today.year:
                for d, lv in fetch_contributions(args.user, prev_year):
                    merged.setdefault(d, lv)
            pairs = list(merged.items())
        except Exception as exc:
            print(f"  fetch error: {exc} -- retrying in {args.interval}s")
            time.sleep(args.interval)
            continue

        fits = name_width(args.user) <= 72
        png, days_placed, levels = render_png(pairs, args.user if fits else None, today, THEMES[args.theme])
        upload_and_draw(args.host, png, scroll_user=None if fits else args.user)
        print(f"user={args.user} days={days_placed} "
              f"L0={levels[0]} L1={levels[1]} L2={levels[2]} L3={levels[3]} L4={levels[4]}")
        time.sleep(args.interval)


def main():
    parser = argparse.ArgumentParser(
        description="Render a GitHub contribution graph on the BUSY Bar."
    )
    parser.add_argument("--host", default="10.0.4.20",
                        help="Device host (default: 10.0.4.20)")
    parser.add_argument("--user", default="maxswinkels",
                        help="GitHub username")
    parser.add_argument("--interval", type=int, default=3600,
                        help="Refresh interval in seconds (default: 3600)")
    parser.add_argument("--theme", choices=sorted(THEMES), default="green",
                        help="color palette for the day grid (default: green)")
    parser.add_argument("--test", action="store_true",
                        help="Use fake data, draw once, exit 0")
    args = parser.parse_args()
    run(args)


if __name__ == "__main__":
    main()