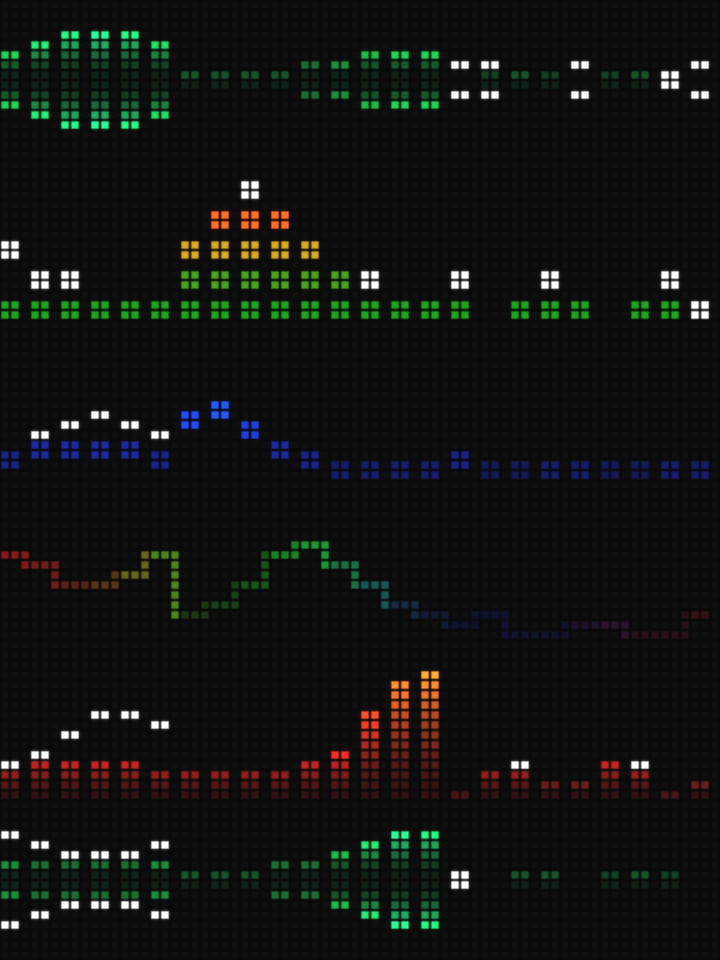
Live microphone spectrum on the LEDs: five render styles (bars, mirror, segments, dots, wave) and colour themes.
A gallery of community-built apps for the 72×16 RGB LED productivity device.
SUBMIT YOUR APP46 apps
Live microphone spectrum on the LEDs: five render styles (bars, mirror, segments, dots, wave) and colour themes.

It has a screen? It can play Bad Apple. And yes, with audio, too!
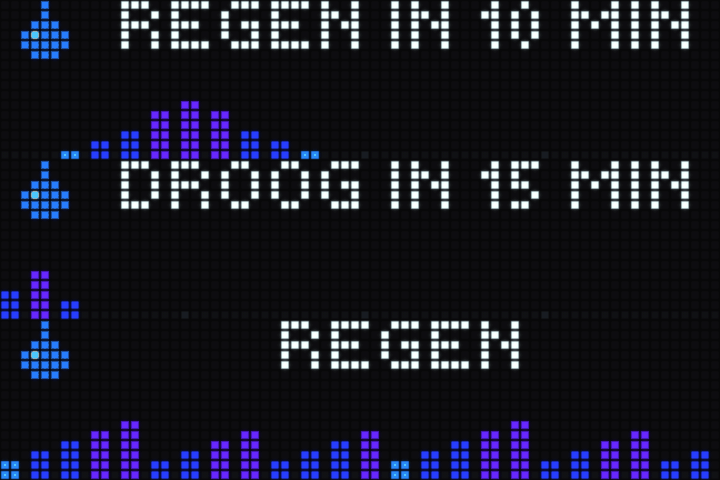
Dutch rain alarm that takes the screen only when rain is coming. Shows minutes until rain or until dry, plus a 2-hour Buienradar intensity timeline colored from drizzle to downpour.
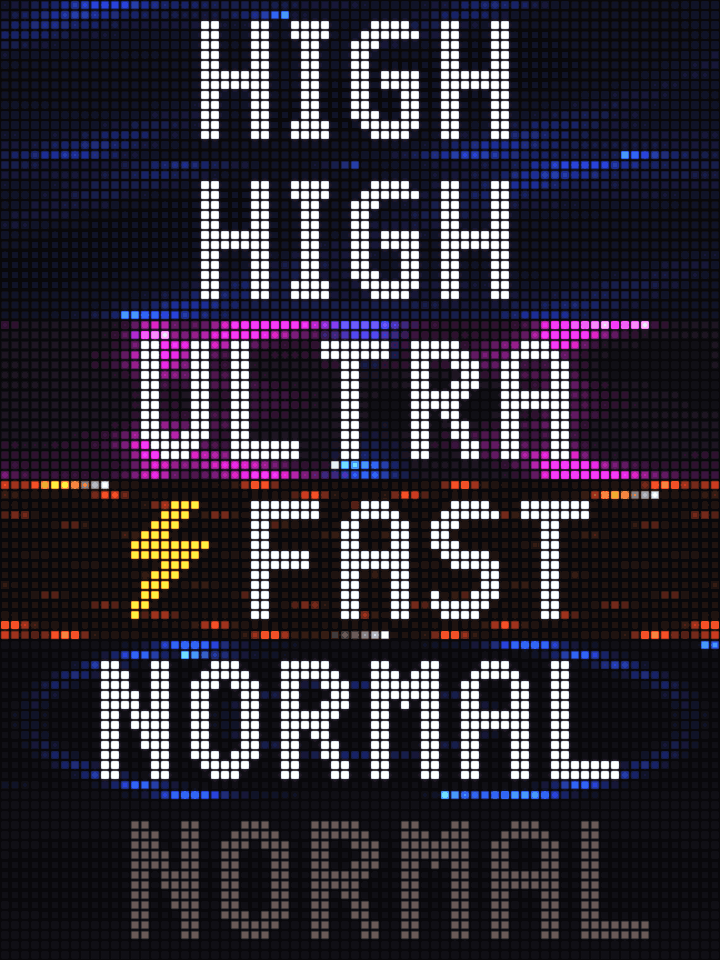
Live Codex task status, account limits and weekly progress, with a reasoning effort dial and START-button Fast mode control for Codex Desktop and a native-control CLI fork.

Activates a built-in BUSY Bar mode and releases it on exit. Themes: busy, keep_out, dnd, meeting, on_call, lunch, back_soon, booked, flow, chill_time, on_air, coding, low_social_battery.
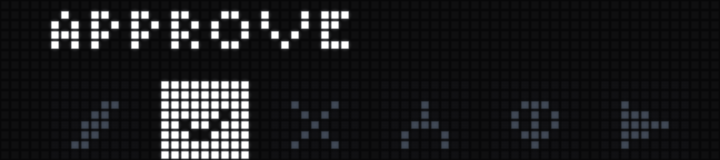
Tactile Codex controller with live task status, actions, navigation, reasoning control, and push-to-talk dictation.
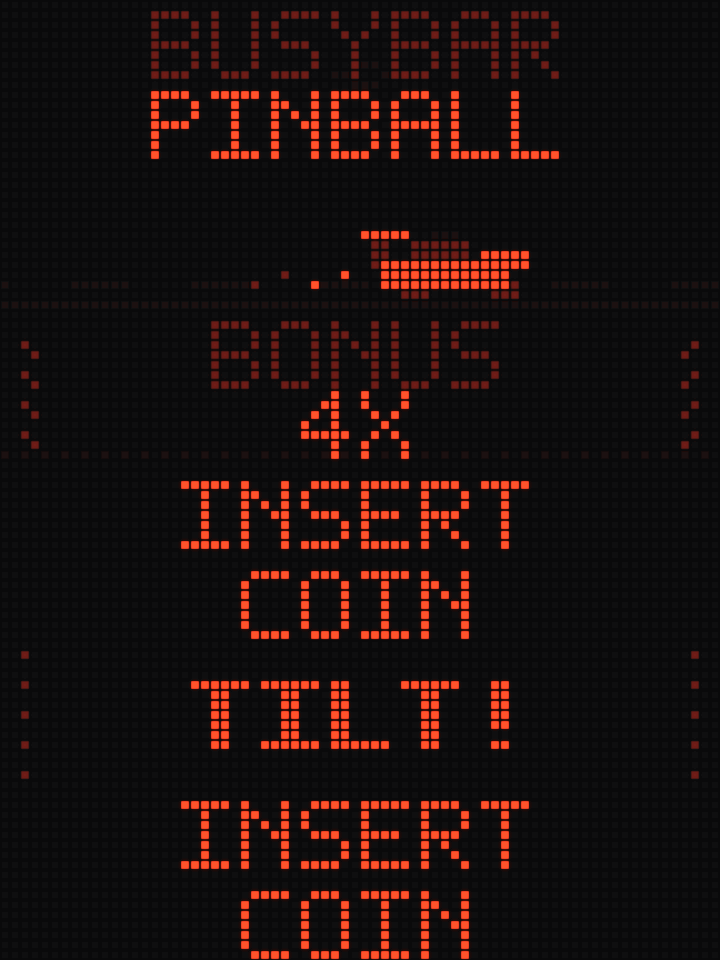
A colorful 90s-style pinball DMD attract mode with scores, jackpots, bonus multipliers, racing animations, Extra Ball, and Insert Coin sequences.
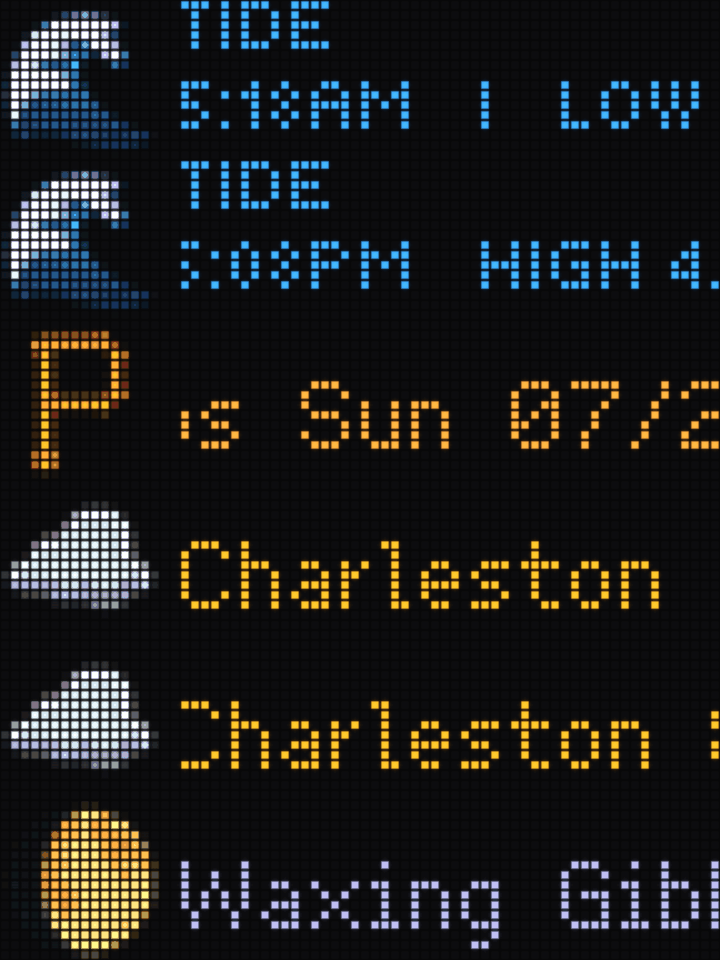
Continuous scrolling ticker with network-synced date/time, weather, moon phase, NOAA tides, and season-aware sports scores. City, tide station, and teams are configurable via config.json.
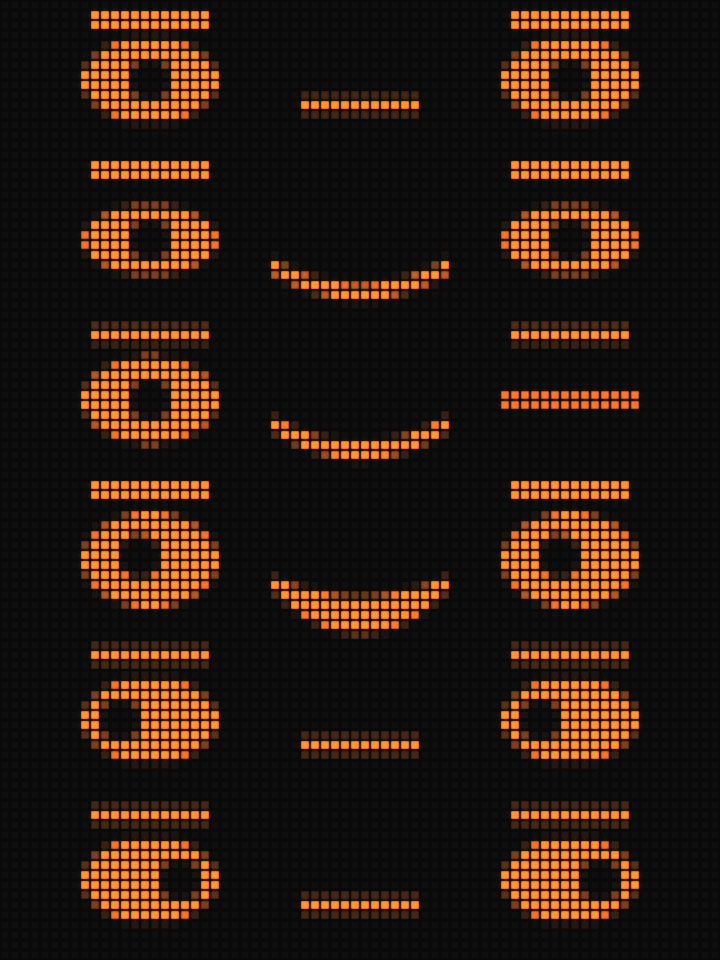
A parametric face that reacts to your machine - CPU load, live Claude Code turns, battery, keyboard idle - and to the bar's buttons and wheel. It blinks, glances around, sweats, and takes a punch.
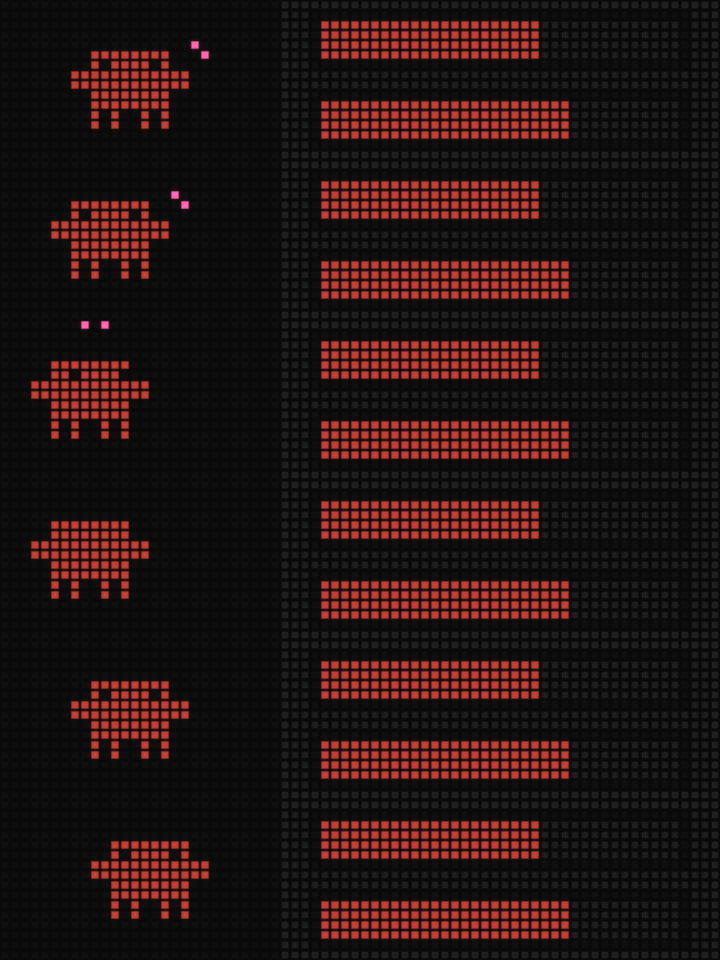
Live Claude Code usage — 5-hour session and weekly limit bars with time to reset, an animated Clawd mascot, and a session-activity readout.

Customizable Clock widget - customizable, big time, refreshed every second.
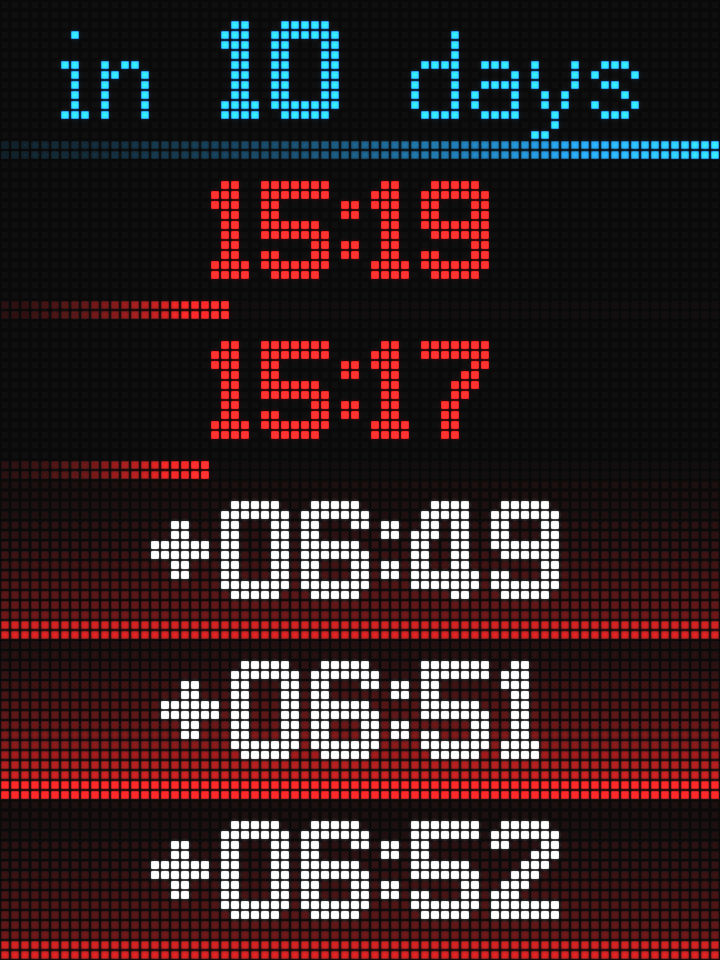
Animated countdown to any moment, coarse when far off and mm:ss in the final hour, with amber/red thresholds and a red count-up once it passes.

A simple counter app with custom formatting and caching. For queue management, or just counting things.
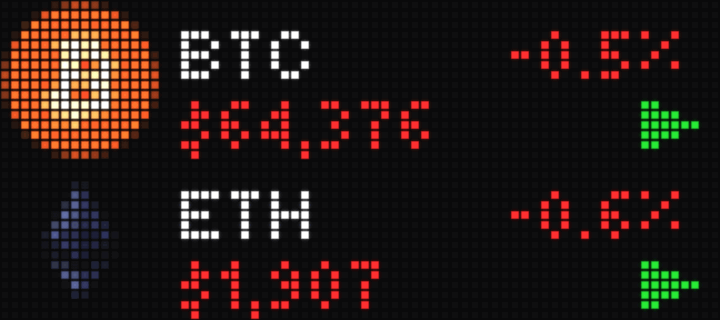
Live crypto prices on the LED matrix -- logo, price and 24h change per coin, with a top-button pause and wheel scrubbing. Prices from CoinGecko.

The classic bouncing DVD screensaver. A colorful pixel logo ricochets around the bar, changes color at every bounce, and occasionally hits the perfect corner.
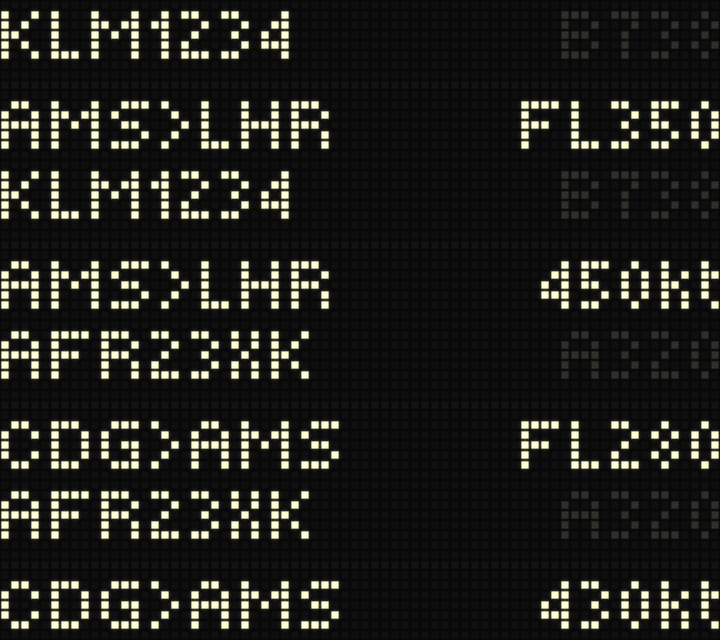
Quiet until a plane flies over, then a split-flap board shows its callsign, aircraft type, route, and live altitude and speed, from live ADS-B data.
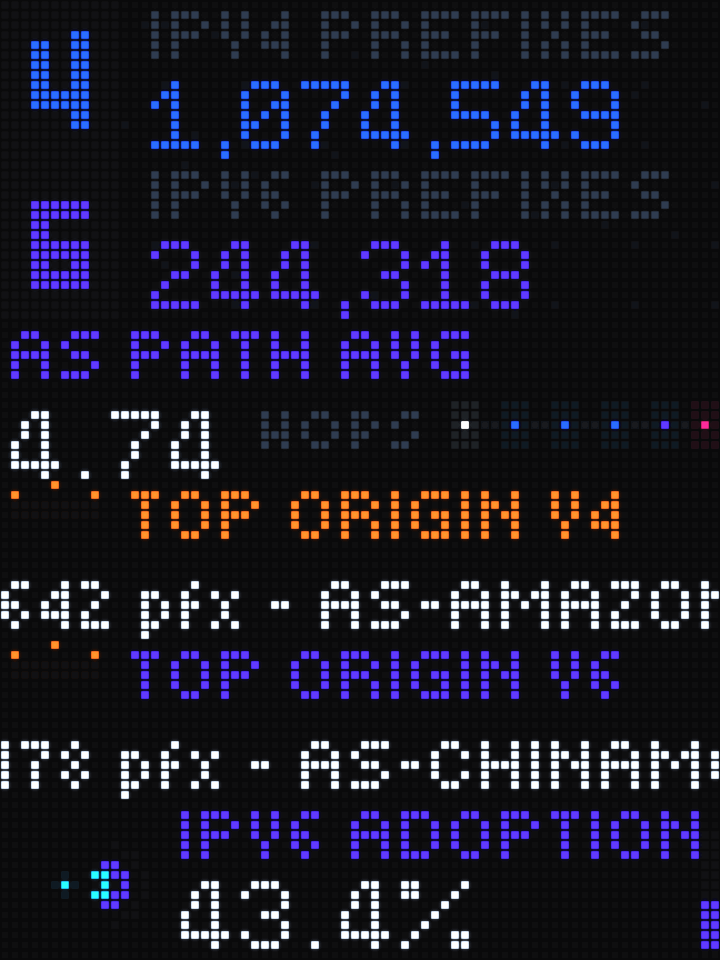
Live Internet routing statistics including IPv4/IPv6 prefixes, FRT size, RPKI status, AS-path length, top origin ASes, and IPv6 adoption.
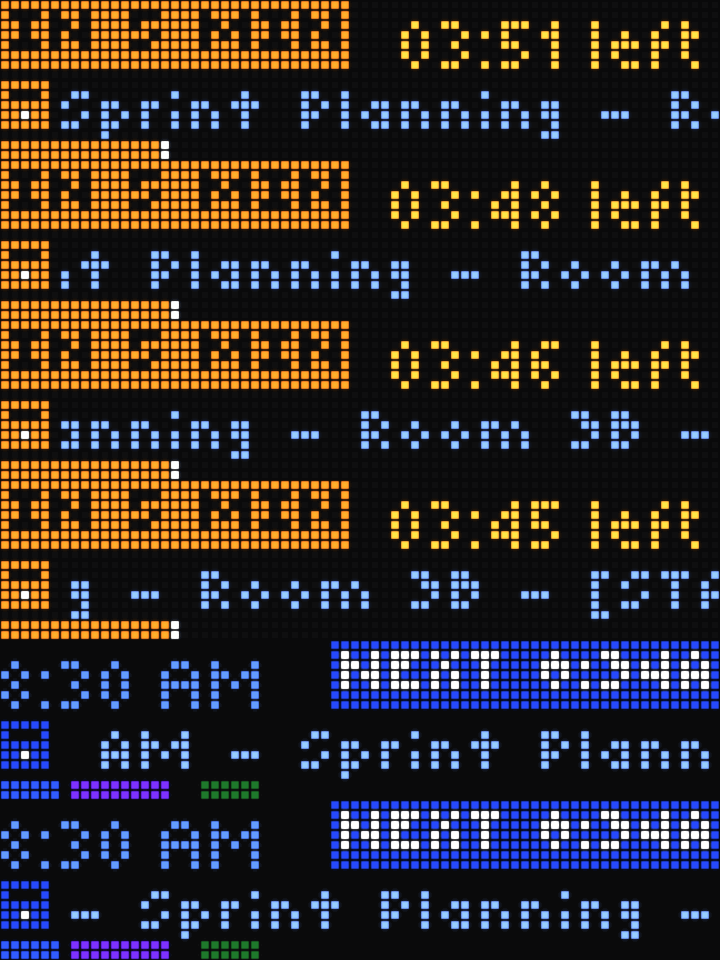
Ambient Google Calendar display for BUSY Bar — at-a-glance meeting countdowns, alerts, and live schedule awareness.
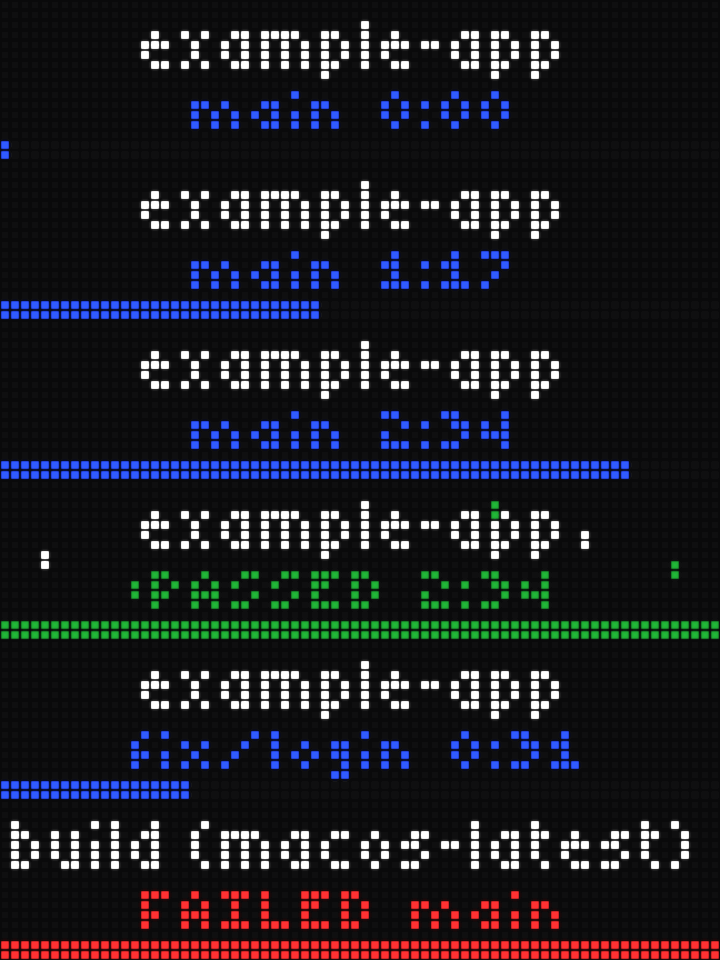
Live GitHub Actions status for the repos you pick: a progress bar while a run works, confetti when it passes, and a red hold naming the job that failed.
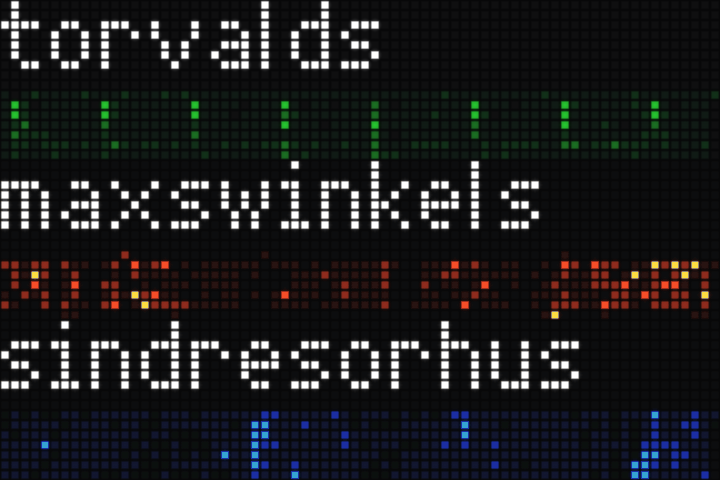
Your GitHub contribution graph on the bar. Username in a 7px pixel font above 72 weeks of history, one pixel per day. Long names scroll, and there are green, orange, and blue themes.
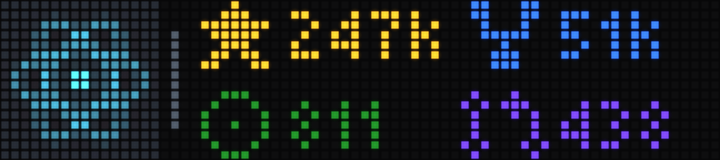
Display a single Github-Repo with stars, forks, open issues and open pull requests. Counts flash when they change.
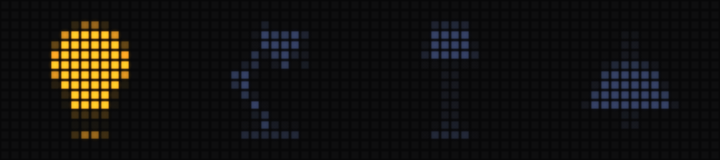
Browse and control Home Assistant lights with the BUSY Bar dial, Select, and Start controls.
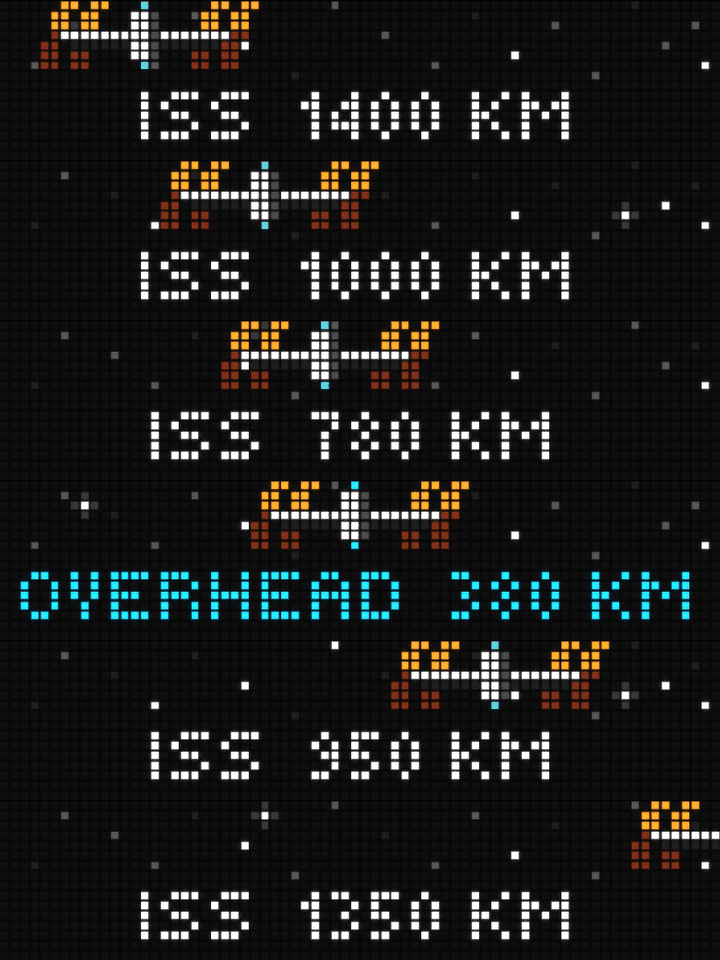
Stays quiet until the space station passes near you. Then a pseudo 3D ISS slides across a twinkling starfield, hangs overhead with live distance, and drifts off the far edge as it leaves.
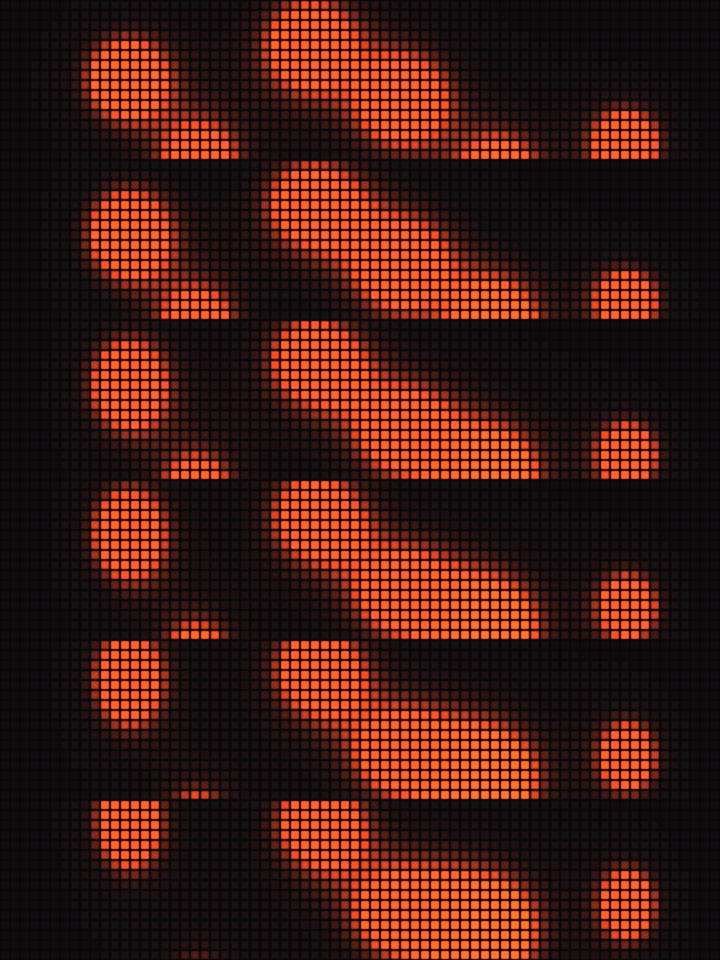
A procedural lava lamp for BUSY Bar with flowing metaballs, surface tension, natural merging and splitting, and highly customizable motion and colors.
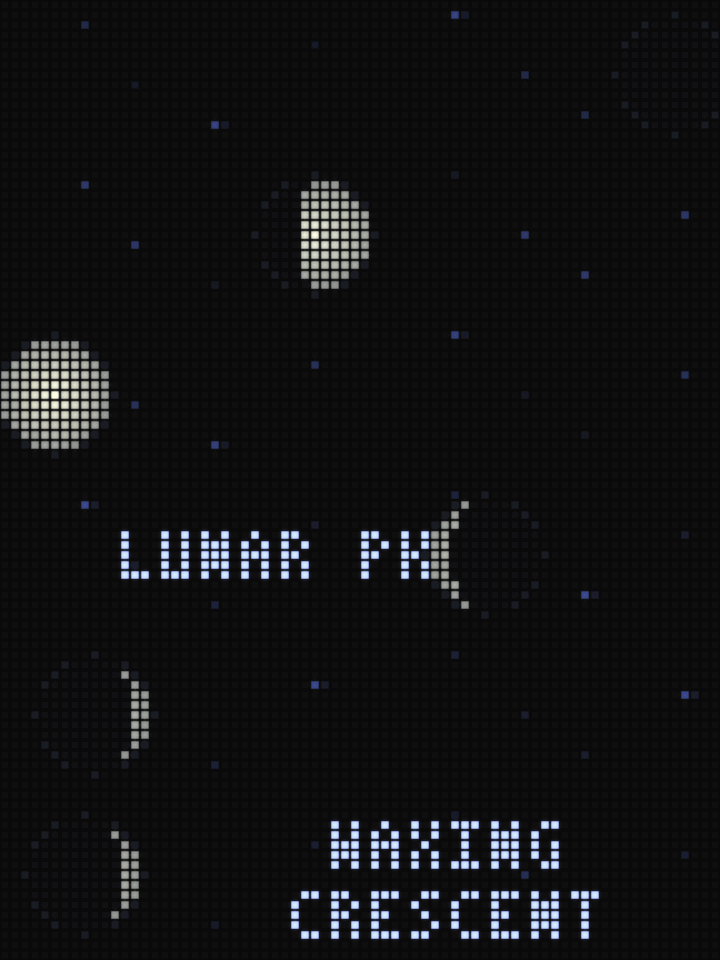
Animated lunar phases for BUSY Bar, showing the current Moon phase with multilingual labels, automatic replay, and button-triggered animation.
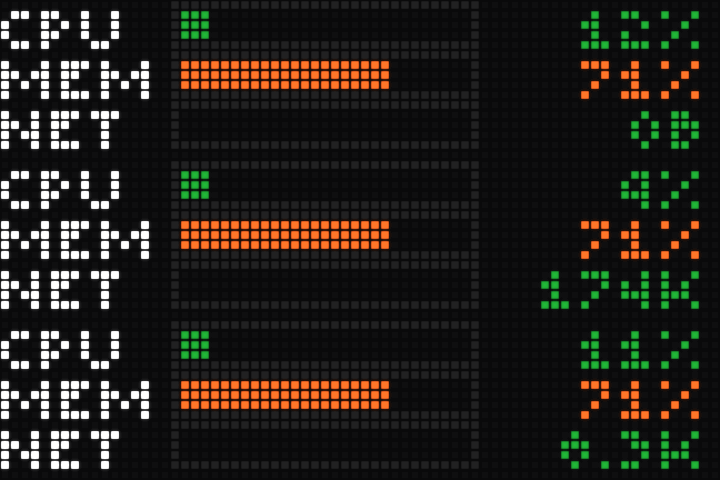
Mac system monitor - CPU, memory and network as live bars.
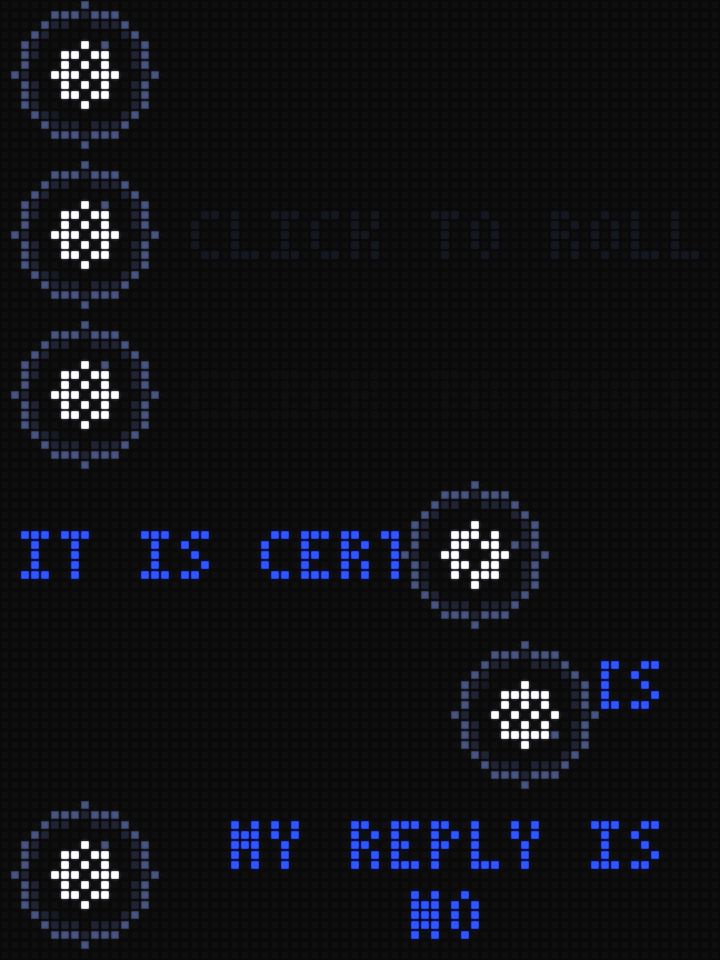
Interactive Magic 8-Ball for BUSY Bar with animated rolling, multilingual answers, button control, and optional auto-roll.

Matrix-style digital rain animation for BUSY Bar, with configurable character size, speed, density, and color theme.
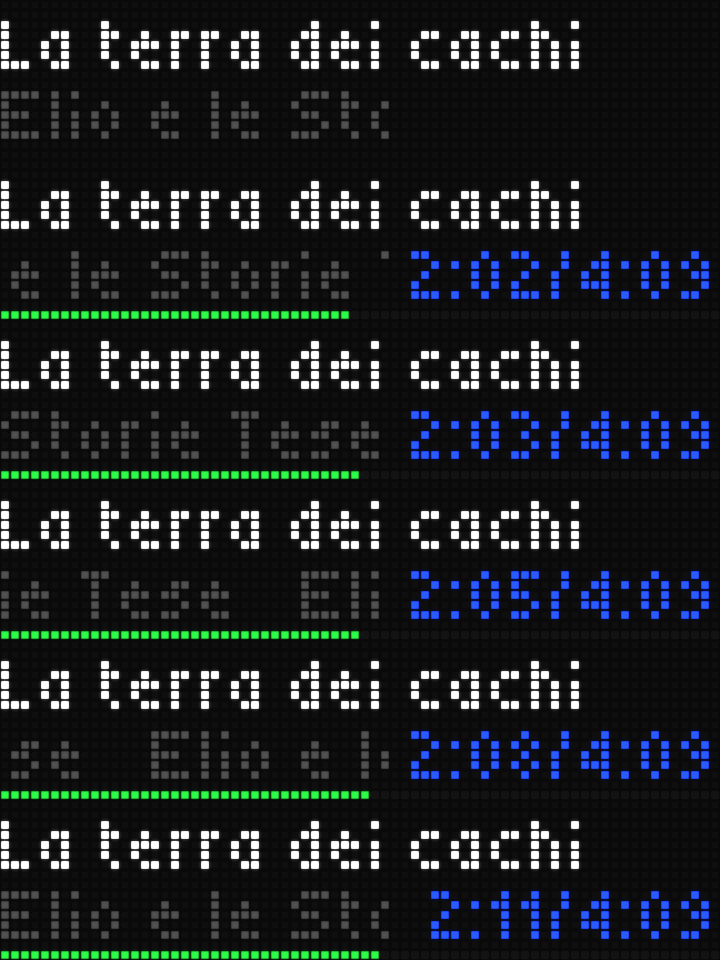
Displays system-wide Now Playing information and provides media controls for BUSY Bar.
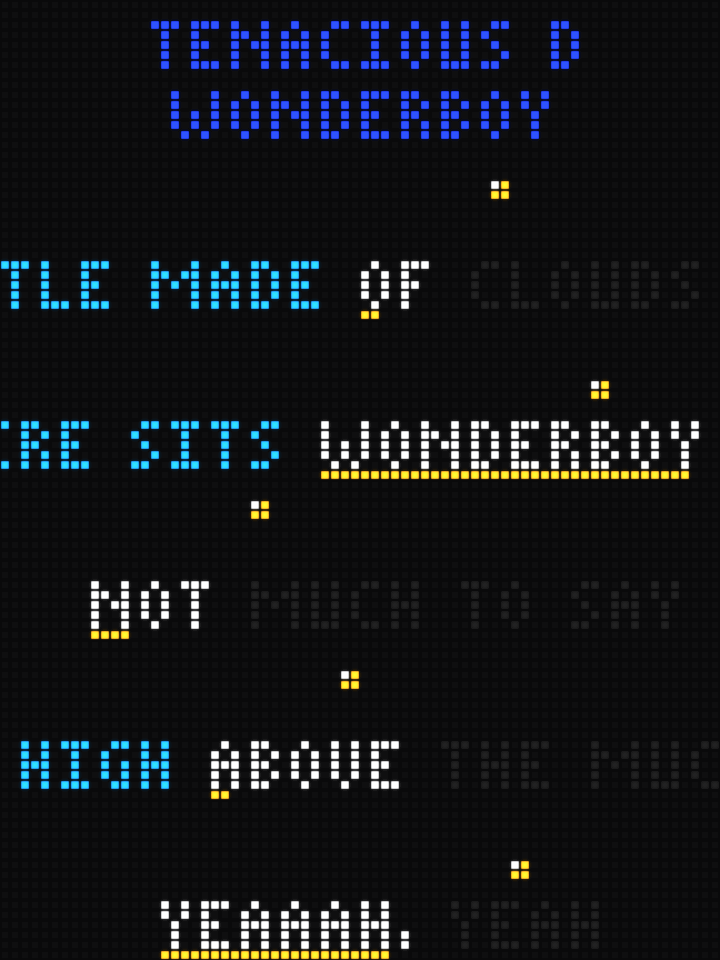
Shows synced song lyrics on BUSY Bar with karaoke highlighting, playback controls, scrolling metadata, and optional two-line lyric mode.

Watches your Moneybird administration and celebrates every newly paid invoice with a coin rain, an odometer count-up of the amount and a cash-register sound.
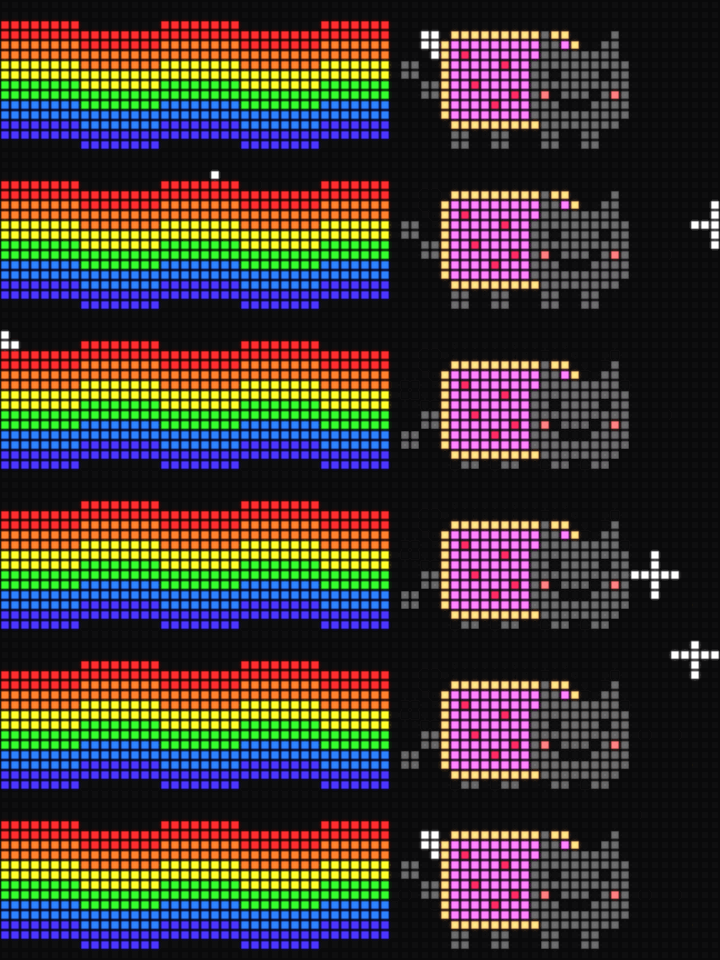
The classic nyan cat - pop-tart cat with a rainbow trail and twinkling stars.
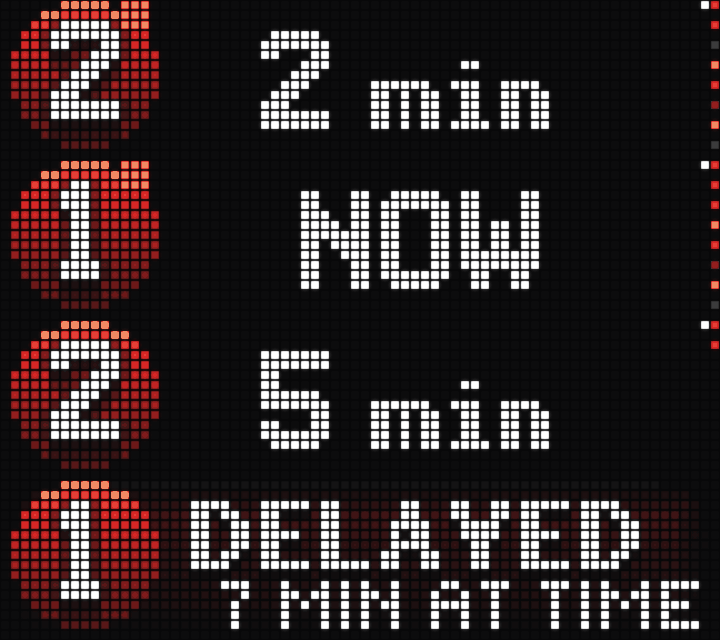
Live next-train departures for any NYC subway station — pick station, direction and lines; MTA route bullets, minutes to train, departure flash. GTFS-realtime, no API key.
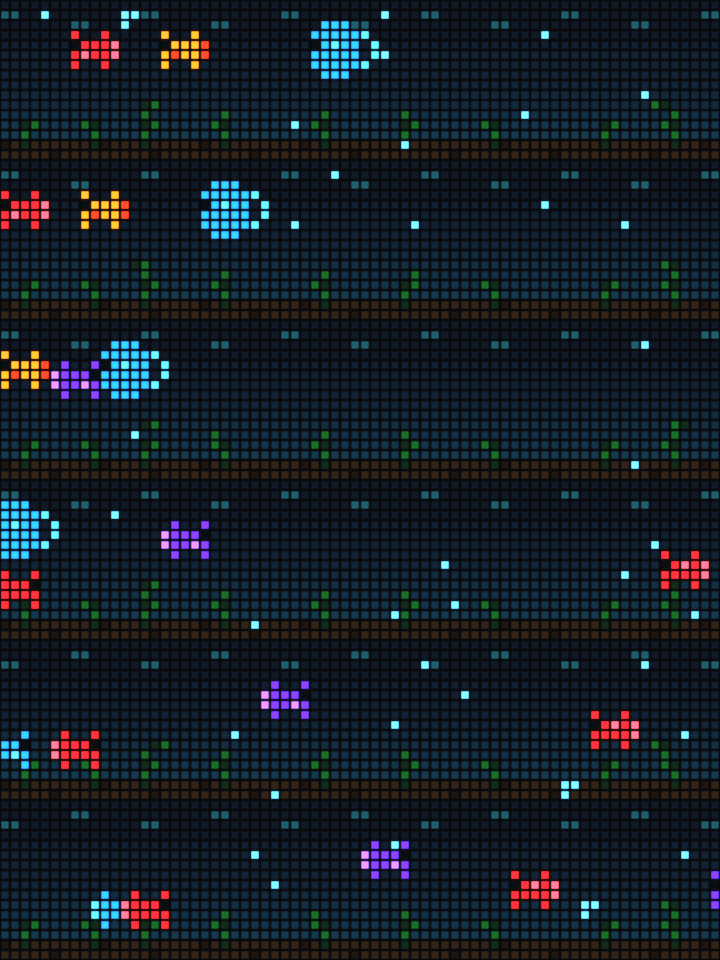
A relaxing procedural pixel aquarium for BUSY Bar, with colorful fish, bubbles, swaying seaweed, and a smooth day/night cycle.
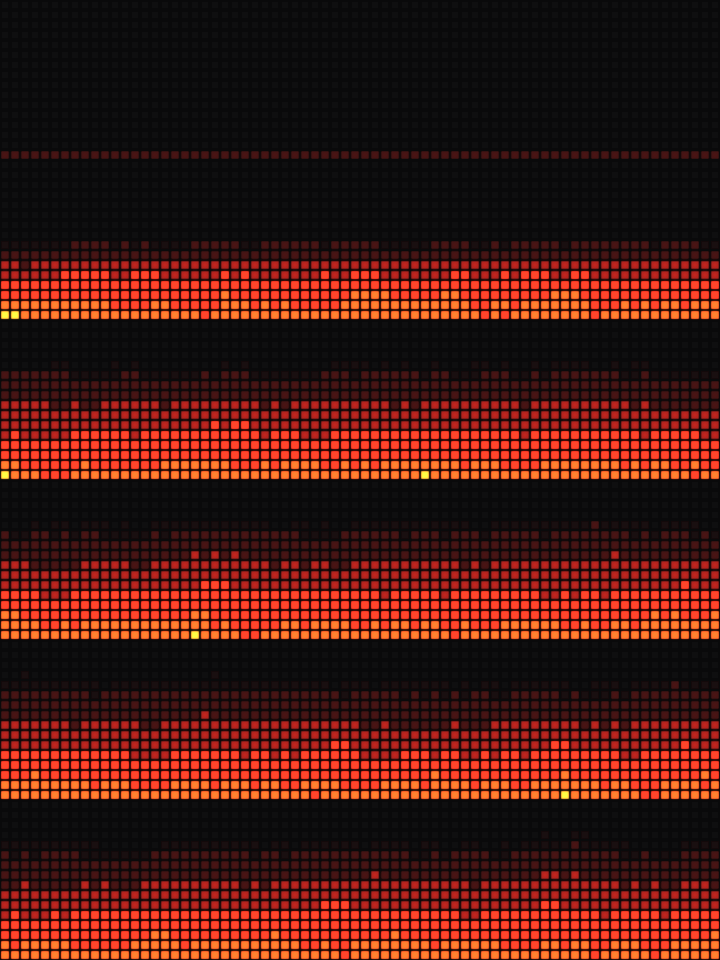
Demoscene pixel effects - fire, matrix rain, and plasma.
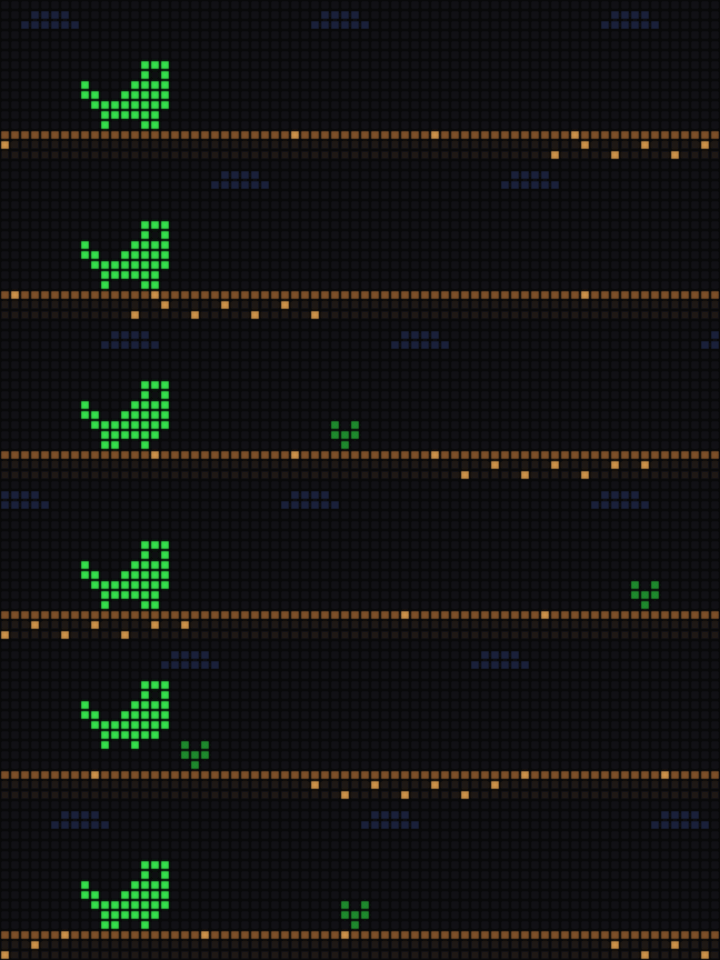
An endless jump-and-duck runner on the 72x16 panel. START jumps, OK or BACK ducks; cacti and birds come at you, the world speeds up, day turns to night. Left alone it plays itself.
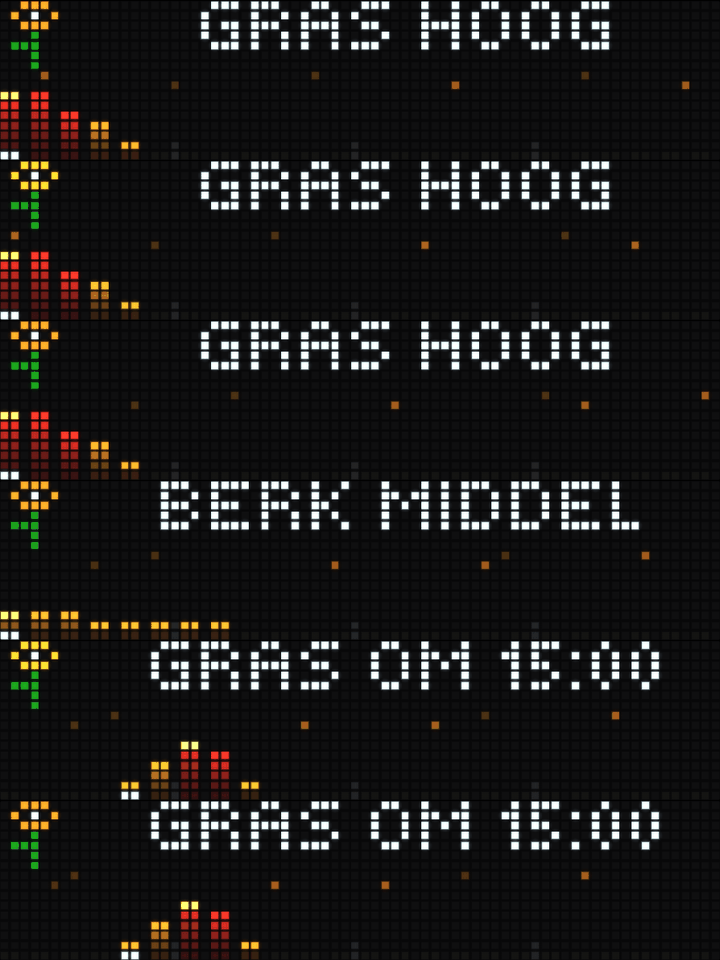
Hay fever alarm for Europe. Quiet while pollen is low, then the worst species with a 24 hour intensity timeline, a marker on the announced hour and drifting pollen specks. Data from Open-Meteo.
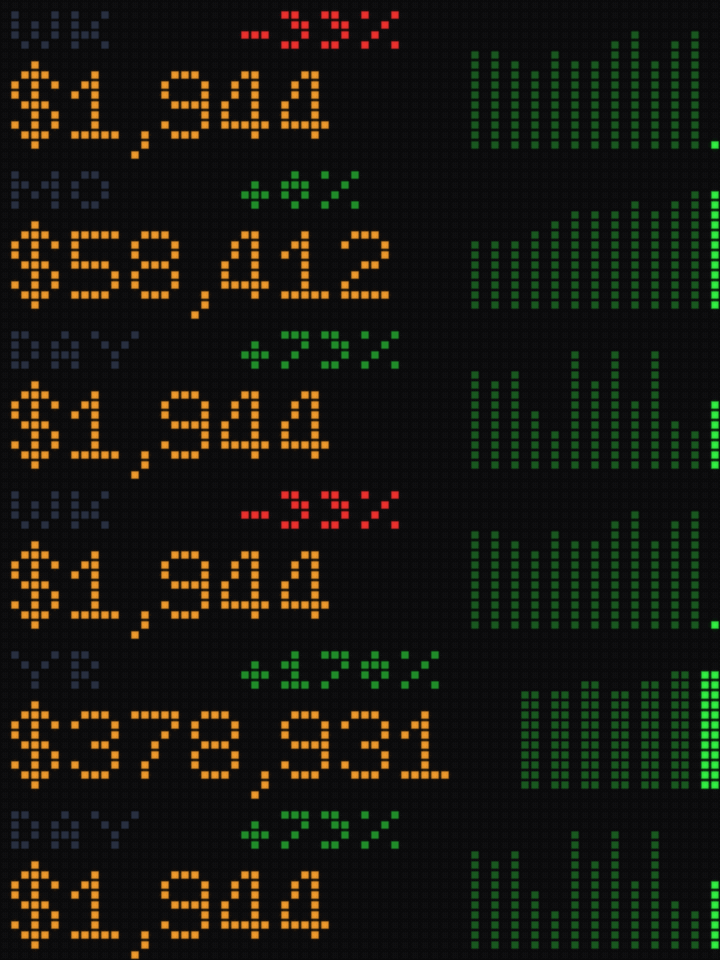
Stripe + Paddle net revenue on your bar. Day, week, month and year to date with trend sparklines and same-point deltas.
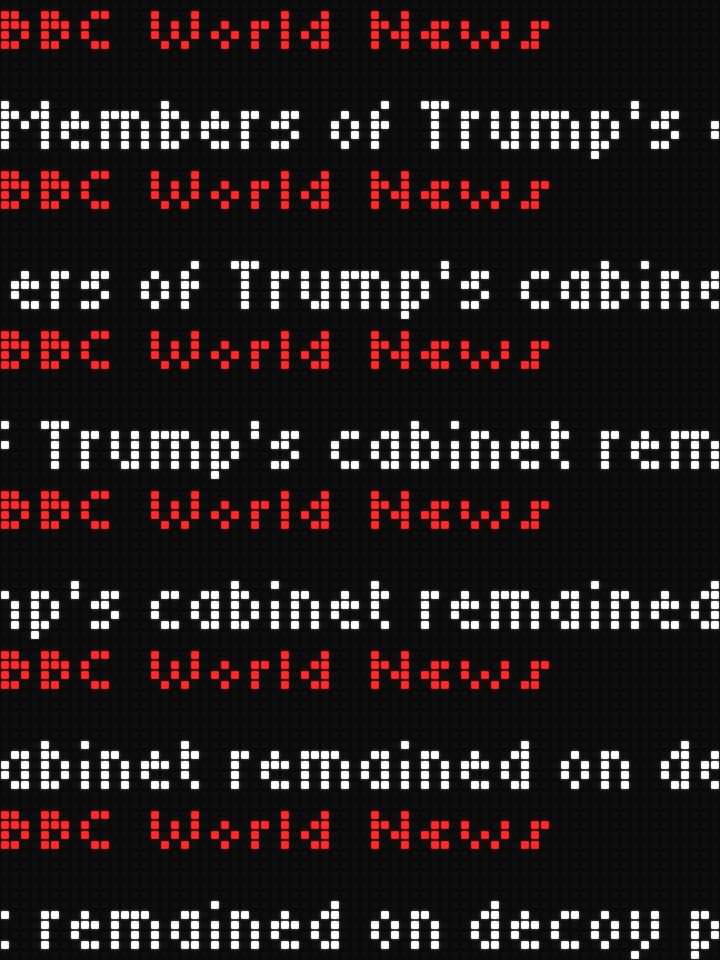
Fetch an RSS feed and show it
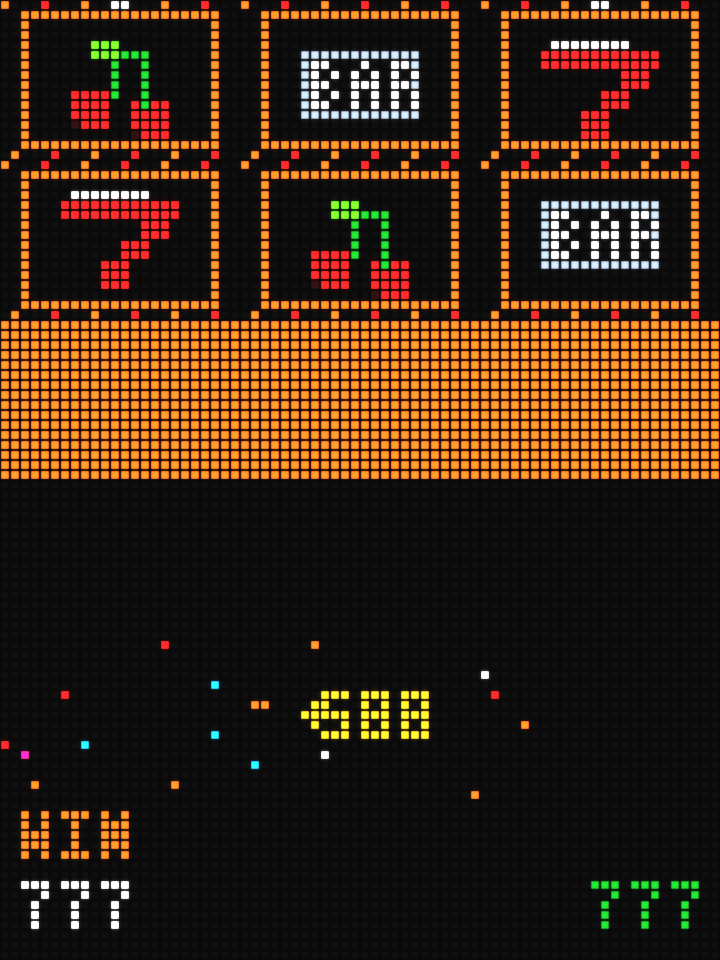
Animated classic fruit-machine slot for BUSY Bar with automatic or START-button spins, cumulative score, win effects, jackpot animations, and sound.
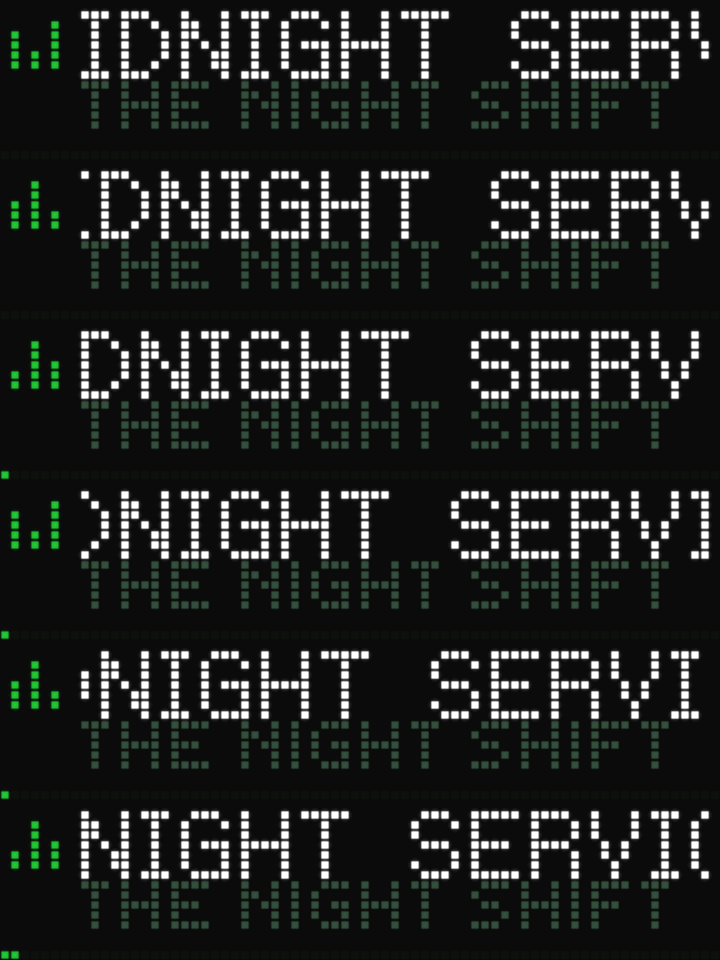
Shows Spotify now playing with progress, play/pause, skip, and volume controls from the BUSY Bar.
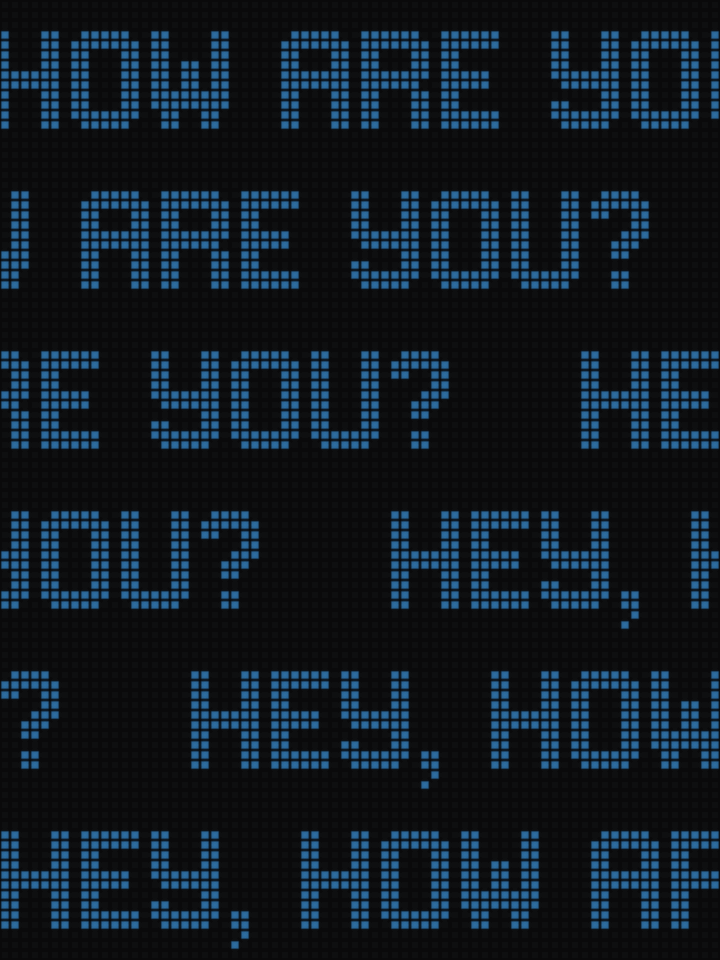
Show some text. That's it!

Alternates between a big clock and the next tide (high/low, height, time) for any NOAA station.
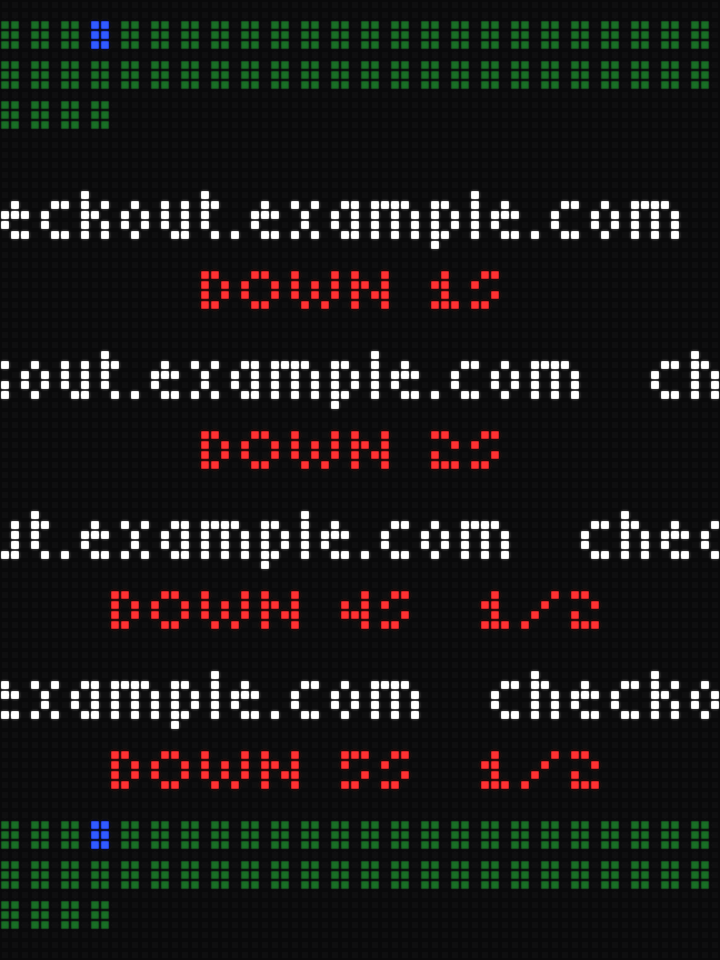
Connects to your Uptime Kuma instance and draws every monitor as one cell in a wall of pixels: dim green while all is well, then a red takeover naming the site and its downtime when one fails.
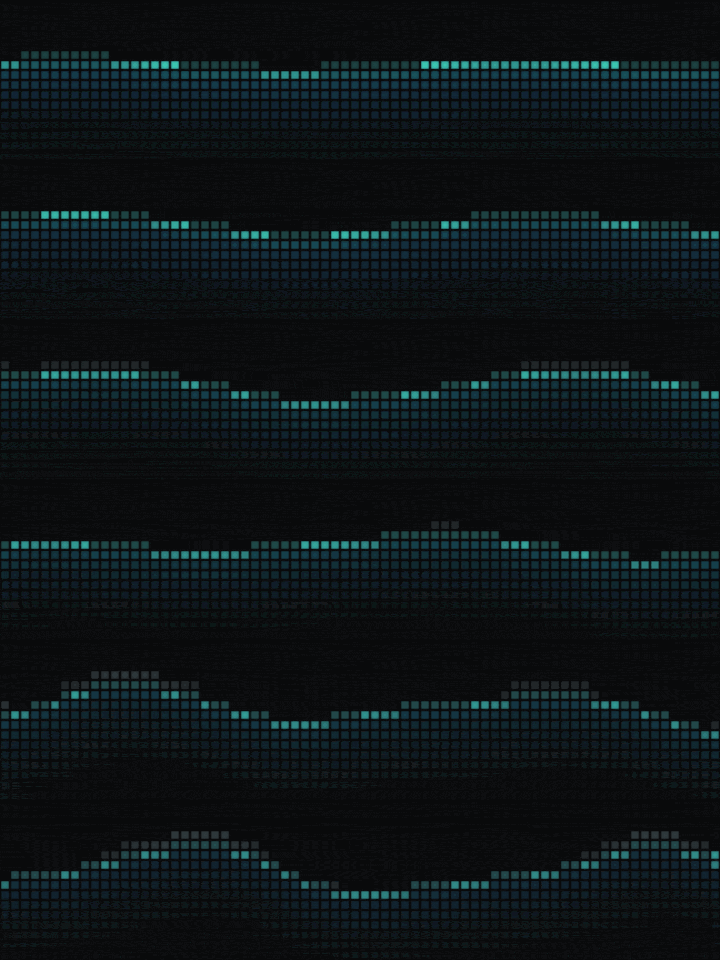
A lava-lamp-like ocean animation for BUSY Bar, with colorful moving waves, smooth transitions from calm to stormy seas, realistic gradients, foam, reflections, sound and configurable speed.
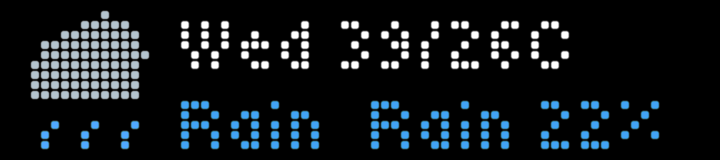
Current weather and multi-day forecasts for BUSY Bar, with configurable location, units, and language.
No apps match that search.
busybar-manager installs, schedules and proxies these apps to a BUSY Bar or the emulator, with autostart and a web dashboard, so you do not have to keep a terminal open per app.
Get busybar-manager →